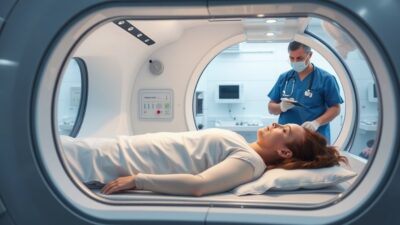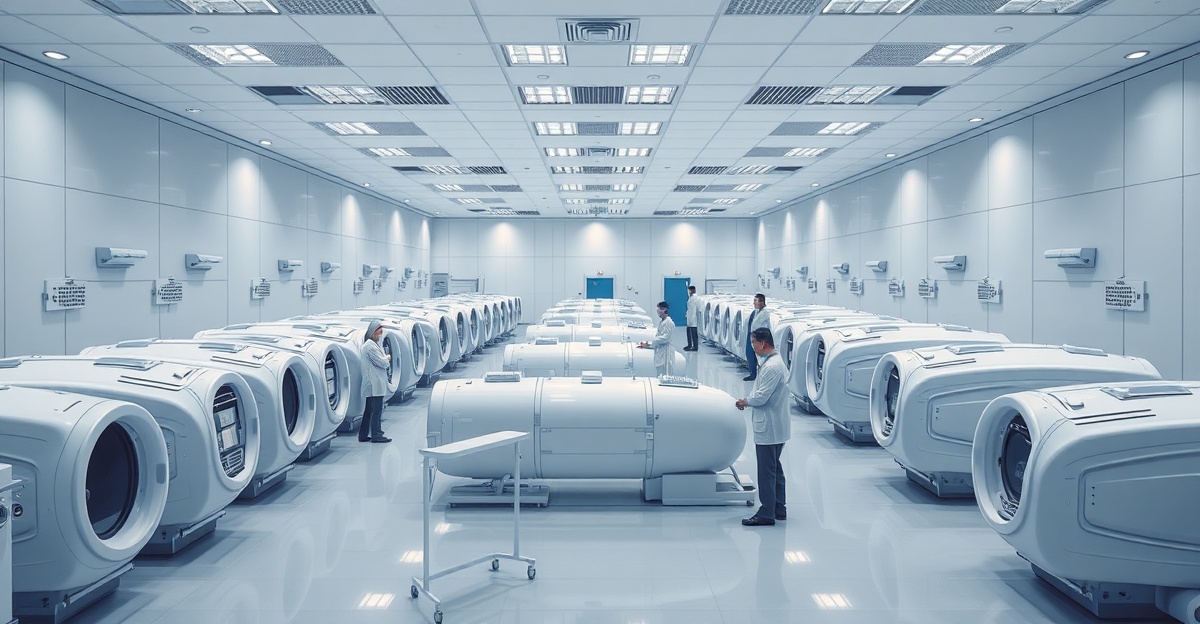
The US went from 27 hyperbaric chambers in 1977 to well over 1,000 programs today. But no single registry captures the full count. Clinical chambers are tracked through hospital licensing, Medicare enrollment, and UHMS accreditation, while the growing number of freestanding wellness centers and home units remains largely uncounted.34
Key Takeaways
- The UHMS Q1 2025 report counts well over 1,000 hyperbaric programs in the US, implying roughly 1,500 to 2,000 clinical-grade chambers, according to UHMS (2025).
- The Regenerated.com verified directory independently confirmed 786 US clinics offering HBOT as of April 2026, led by California with 151.
- The US count grew from about 27 chambers in 1977 to over 1,000 programs in 2025, according to JAMA (1981) and UHMS (2025).
- Home soft chambers at 1.3 ATA number an estimated 15,000 to 25,000 units, outnumbering clinical chambers by roughly 10 to 1.
- Perry Baromedical and Sechrist Industries dominate the US clinical chamber market, with new multiplace units costing $500,000 to $2,000,000 or more.
US Hyperbaric Chamber Count at a Glance (2026)
| Metric | Number | Year | Source | Data Confidence |
|---|---|---|---|---|
| Clinical hyperbaric programs | 1,000+ | 2025 | UHMS Q1 2025 report | High (counted) |
| Clinical-grade chambers | 1,500 to 2,000 (estimate) | 2025 | BaricBoost derivation | Medium (derived) |
| Verified US clinics offering HBOT | 786 | April 2026 | Regenerated.com verified directory | High (individually verified) |
| Home soft chambers (1.3 ATA) | 15,000 to 25,000 (estimate) | 2026 | BaricBoost estimate | Low (uncounted market) |
How Many Clinical Hyperbaric Chambers Are in the US?
The most reliable data point is from the UHMS Q1 2025 Report: “well over 1,000 hyperbaric programs” in the US.1 Since programs often operate multiple chambers (hospital wound care centers typically run 2-6 chambers), this suggests approximately 1,500-2,000+ clinical-grade chambers nationwide. That chamber figure is a BaricBoost derivation (program count multiplied by typical chambers per program), not an official census, so treat it as an estimate with medium confidence.
Distribution by Facility Type
The facility-type split below is a BaricBoost estimate built from UHMS accreditation listings, CMS provider enrollment, and the Divers Alert Network recompression chamber directory.345
| Facility Type | Estimated Chambers | Share | Primary Use |
|---|---|---|---|
| Hospital wound care centers | ~1,200 | 55-60% | FDA-cleared indications, insurance-covered |
| Freestanding HBOT clinics | 400-600 | 20-30% | Mix of on-label and off-label, often cash-pay |
| Military/VA facilities | 60-80 | 3-4% | TBI, wound care, decompression sickness |
| University/research | 40-60 | 2-3% | Clinical trials, academic medicine |
| Emergency/dive medicine | 50-70 | 3% | Decompression sickness, CO poisoning |
How Has the Number of Hyperbaric Chambers Grown Since 1977?
From about 27 chambers in 1977 to well over 1,000 programs in 2025, the US hyperbaric footprint has expanded roughly 40-fold in five decades. A 1981 JAMA report by Gunby documented the early phase of that expansion, counting about 93 chambers in 1981 with 20 more expected.6
| Year | Chambers/Programs | Source |
|---|---|---|
| 1977 | ~27 chambers | JAMA 1981 |
| 1981 | ~93 chambers (+20 expected) | JAMA 1981 |
| 2025 | 1,000+ programs | UHMS Q1 2025 |
How Many Home Hyperbaric Chambers Are There in the US?
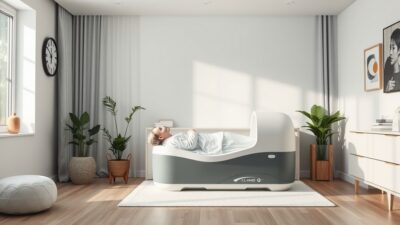
An estimated 15,000 to 25,000 home soft chambers operating at 1.3 ATA are in private hands in the United States. No registry tracks consumer units, so this is a low-confidence market estimate rather than a count. These are purchased for wellness, recovery, and off-label health conditions.
It is worth understanding that soft and hard chambers deliver fundamentally different oxygen levels. Soft chambers at 1.3 ATA produce an oxygen partial pressure of approximately 230 mmHg, while hard chambers at 2.0 ATA deliver around 1,520 mmHg.
How Does US Chamber Density Compare Internationally?
As of 2020, China had 1,924 institutions offering HBOT with 2,699 chambers and 11,266 practitioners, according to a nationwide survey by Zhang, Yang, and Li.7 This peer-reviewed data point provides useful international context. The US, at approximately 6-7 clinical chambers per million people, compares to Israel at 15-20 per million (the world’s highest per-capita density) and the UK at 3-4 per million; the per-million figures are BaricBoost estimates.
State-by-State Chamber Density
Verified data point: the Regenerated.com vetted clinic directory (operated by BaricBoost’s founder) independently verified 786 US clinics offering HBOT as of April 2026, led by California (151), Texas (127) and Florida (70). Full state and city tables are in our HBOT clinic count analysis. The chamber ranges below are BaricBoost estimates; the clinic counts above are individually verified.
| State | Estimated Clinical Chambers | Key Factors |
|---|---|---|
| Florida | 180-220 | Large elderly population, diving community |
| Texas | 160-200 | Large population, military bases |
| California | 150-190 | Population size, wellness culture, VA system |
| Arizona | 60-80 | Retirement population, integrative medicine hub |
| New York | 80-100 | Large hospital systems, academic medical centers |
Access Gaps
Approximately 70% of clinical chambers are located in metropolitan areas with populations over 250,000 (BaricBoost estimate from the facility distribution above). Rural patients often face drives of 100 miles or more to the nearest hyperbaric facility. States with the lowest per-capita chamber density include Wyoming, Montana, North Dakota, Vermont, and Alaska.
Global Market Size
The global HBOT market was valued at approximately $3.98 billion in 2025 and is projected to reach $6.71 billion by 2034 at a 5.96% CAGR, according to Precedence Research.2 The US market alone was valued at approximately $1 billion in 2025, projected to reach $1.72 billion by 2034.2 Our HBOT market size analysis breaks these projections down by segment.
Chamber Growth Trends: Clinical vs. Home
The total number of hyperbaric chambers in the US is growing on two parallel tracks that look nothing alike.
Clinical chambers (hospital and freestanding) are growing at roughly 5 to 8% annually (BaricBoost estimate). New hospital installations are modest, as most growth comes from freestanding clinics adding monoplace units. The typical new freestanding clinic opens with 1 to 3 monoplace chambers and adds capacity based on demand. At the current growth rate, the US clinical chamber count is projected to reach 2,500 to 3,000 by 2030. Patient volume is growing on a similar track; see how many people receive HBOT per year.
Home chambers are growing far faster, estimated at 20 to 30% annually. The consumer market for soft chambers at 1.3 ATA has exploded since 2020, driven by social media exposure, long COVID self-treatment, and biohacking culture. If the estimated 15,000 to 25,000 home units is accurate, home chambers already outnumber clinical chambers by roughly 10 to 1. By 2030, home units could reach 50,000 to 80,000.
The clinical significance of this gap matters. Home soft chambers at 1.3 ATA deliver approximately 230 mmHg arterial oxygen. Clinical hospital chambers at 2.4 ATA deliver approximately 1,824 mmHg. That is an 8-fold difference. None of the UHMS-accepted indications (15 condition categories in the 15th edition indications manual) have evidence supporting treatment at 1.3 ATA.
Monoplace vs. Multiplace: The Capacity Question
Of the estimated 1,500 to 2,000 clinical chambers in the US, the vast majority are monoplace units. Only an estimated 100 to 150 multiplace chambers remain in operation, down from higher numbers in the 1990s and 2000s.
This matters for patients because multiplace chambers offer capabilities monoplace units cannot: inside-attendant care for critically ill patients, pressures up to 6.0 ATA for emergency decompression, and accommodation of patients with severe claustrophobia. A 2016 retrospective review by Churchill et al. in Undersea & Hyperbaric Medicine found that monoplace patients experienced more visual acuity changes (32% reached 20/40 or worse) compared to multiplace patients (18%), likely due to the continuous 100% oxygen atmosphere in monoplace units.8
The decline in multiplace chambers is driven by cost. A new multiplace installation runs $500,000 to $2,000,000+ versus $50,000 to $150,000 for a monoplace unit. Hospital administrators facing budget pressure are replacing retiring multiplace systems with banks of monoplace chambers that cost less to install and maintain but cannot replicate multiplace clinical capabilities.
Manufacturing and Supply Chain
The clinical hyperbaric chamber market in the US is dominated by two manufacturers: Perry Baromedical and Sechrist Industries. Both produce monoplace and multiplace chambers meeting ASME PVHO-1 standards. Lead times for new clinical chambers typically run 3 to 6 months.
The consumer market is more fragmented, with manufacturers including OxyHealth, Summit to Sea, Newtowne Hyperbarics, and several Chinese manufacturers (Macy-Pan, OxyRevo). Consumer chamber prices range from $4,000 for basic soft shells to $40,000+ for hard shell units rated above 1.3 ATA.
Sources
- Undersea and Hyperbaric Medical Society. 2025 Q1 Report. uhms.org. Accessed August 2026.
- Precedence Research. Hyperbaric Oxygen Therapy Market Size 2025-2034. precedenceresearch.com. Accessed August 2026.
- Undersea and Hyperbaric Medical Society. Accredited Facilities directory. uhms.org. Accessed August 2026.
- Centers for Medicare & Medicaid Services. Medicare Provider Enrollment Data. cms.gov. Accessed August 2026.
- Divers Alert Network (DAN). Emergency Recompression Chamber Network. diversalertnetwork.org. Accessed August 2026.
- Gunby P. “HBO: new chambers, some growing pains.” JAMA, 1981;246(11). DOI: 10.1001/jama.1981.03320110005003
- Zhang Y, Yang J, Li JS. “Clinical application of hyperbaric oxygen therapy in China: A 2020 baseline survey.” Undersea & Hyperbaric Medicine, 2022;49(2):179-190. PMID: 35580485
- Churchill S, Deru K, Wilson G, Cable R, Bell JE, Weaver LK. “Rates of visual acuity change in patients receiving hyperbaric oxygen in monoplace and multiplace chambers.” Undersea & Hyperbaric Medicine, 2016;43(3):217-223. PMID: 27416689
Medical Disclaimer
The content on BaricBoost.com is for informational purposes only and is not intended as a substitute for professional medical advice, diagnosis, or treatment. Always seek the advice of your physician or other qualified health provider with any questions you may have regarding a medical condition. Never disregard professional medical advice or delay in seeking it because of something you have read on this website.

Author
Seph Fontane Pennock is the founder of BaricBoost.com and Regenerated.com, a clinic directory for regenerative medicine serving 10,000+ providers across the United States. He previously built and sold PositivePsychology.com, which grew to 19 million users and became the largest evidence-based positive psychology resource on the web. Seph brings direct experience as an HBOT patient, having completed protocols at clinics across three continents while navigating mold illness, systemic inflammation, and autoimmune conditions. His treatment journey includes hyperbaric oxygen therapy, peptide protocols, NAD+ therapy, and consultations with specialists from Dubai to Cape Town to Mexico. This combination of entrepreneurial track record and lived patient experience shapes everything published on BaricBoost.com. Every article is grounded in peer-reviewed research, informed by real clinical encounters, and written for patients making high-stakes treatment decisions. Seph's focus is on bringing transparency, scientific rigor, and practical guidance to the hyperbaric oxygen therapy space.